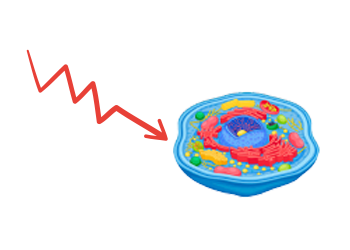
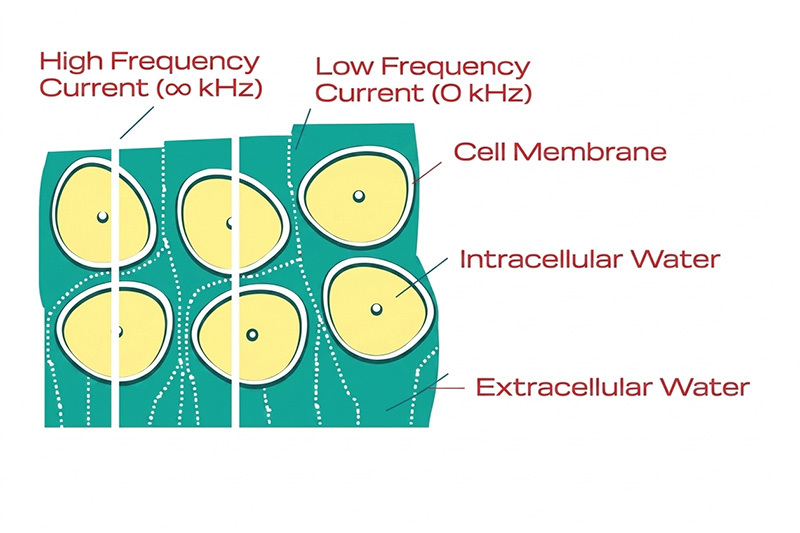
What do your measurement results mean?During the congress, you were measured with an advanced device that looks beyond weight or BMI alone. It measures what is happening inside your body — at the level of your cells, muscles and fluids. The four values on your results card give a unique picture of how healthy your body is on the inside. They can give an early warning if your muscles or cells need extra attention — often before you notice any symptoms yourself. Below, we explain each value in plain language, so you understand what your result means for your health. Phase AngelPhase Angle a prognostic indicator of cellular health shows how well cells resist and store current, with higher values indicating strong, healthy cells and lower values suggesting muscle loss (sarcopenia) or poor health. It's great for spotting early sarcopenia or frailty before symptoms appear, tracking declines in nutrition or vitality. Prediction Marker (TBW/ECW Ratio)A greater variance between these values indicates healthier cells, whereas a ratio closer to 1.00 suggests poor cellular health and fluid overload (e.g., lymphedema), as well as muscle loss (sarcopenia). A high ratio often signals worsening conditions and is useful for tracking sarcopenic obesity, cachexia, or fluid shifts. Cell Membrane CapacitanceThis measures how much charge cell membranes can hold, with high values reflecting robust, healthy cells and low values pointing to muscle loss (sarcopenia) or fluid-damaged cells (lymphoedema). It's a key marker for detecting sarcopenia or frailty as cell health declines. Characteristic FrequencyCharacteristic Frequency is the point where cells resist current most, with a lower value showing strong, healthy cell membranes and a higher value indicating weak or fewer cells (sarcopenia). It helps track muscle cell damage or changes in sarcopenia and cachexia over time.
|

Cardiometabolic Health & Advanced Risk Management ...